Key statistics, explained
On this page
The Key statistics card on a stock's page packs the standard figures into one grid. This article explains each one, so you know what you are looking at and what it can and cannot tell you.
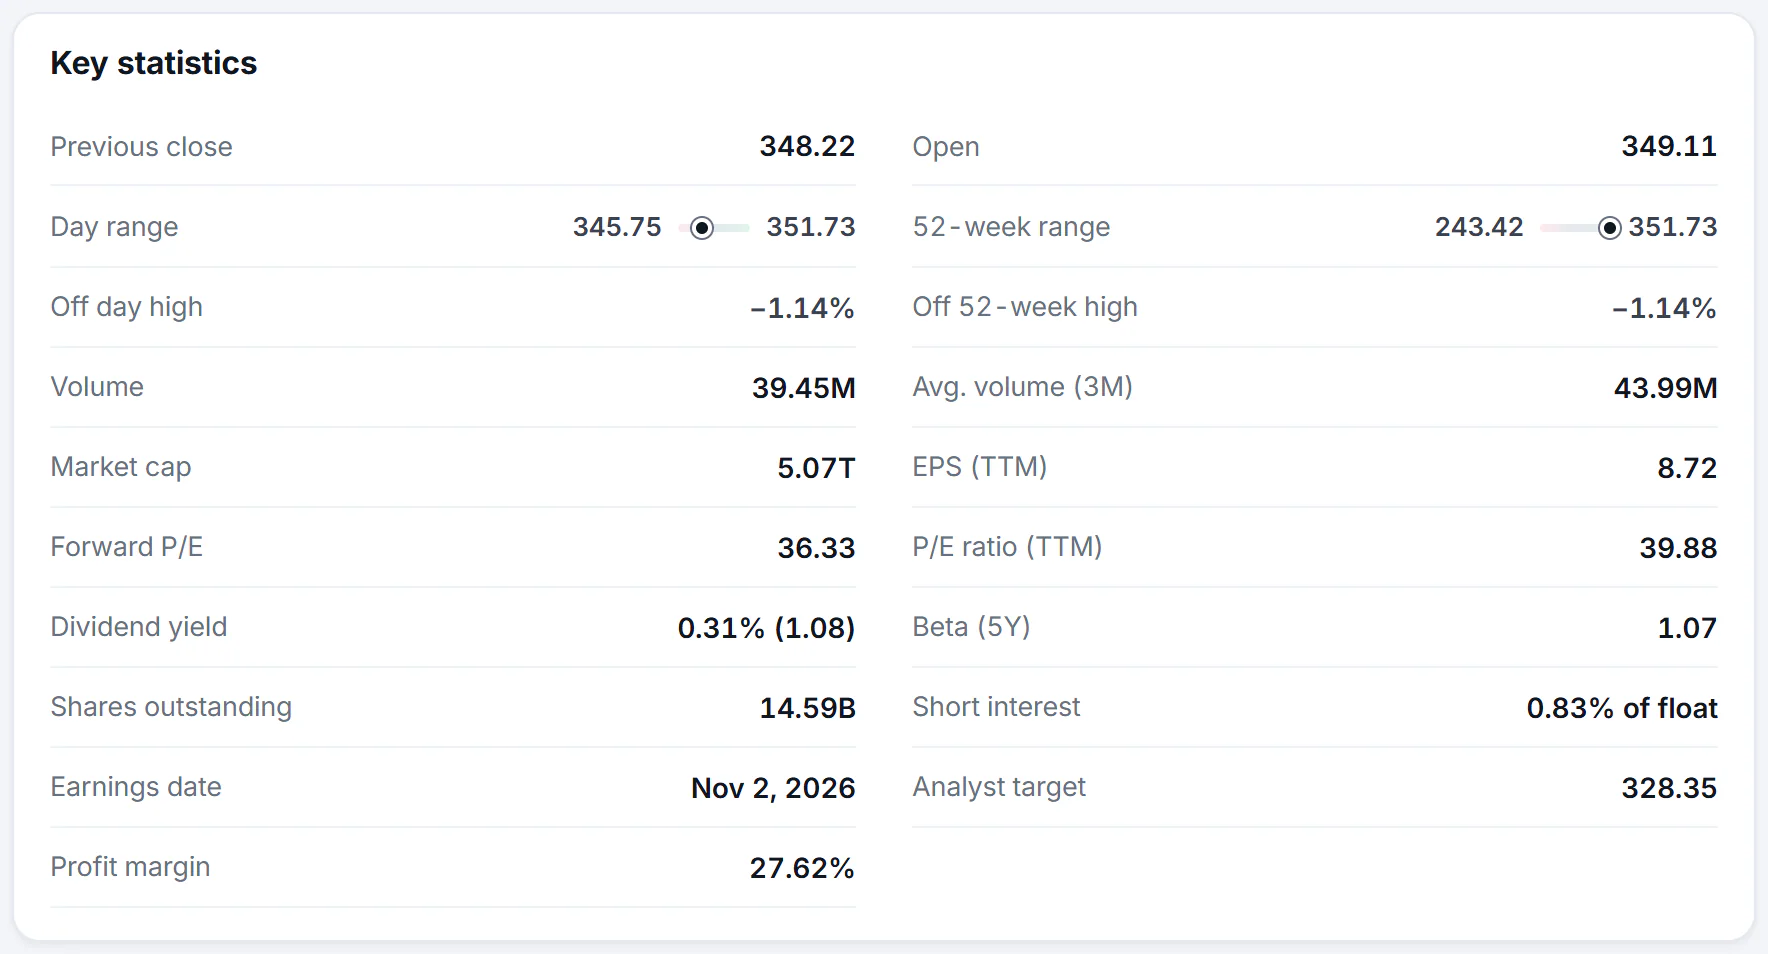
The Key statistics card for a stock. Hover over a label to see a short explanation where one is provided.
- 1Day range: where the price sits between today's low and high
- 2How far below the 52-week high
- 3Market cap: the value of all shares
- 4P/E ratio: price against a year of earnings
- 5Dividend yield
#The price statistics
- Previous close: the price at the end of the last regular trading day. Today's change is measured against it.
- Open: the price of the first trade today.
- Day range: today's lowest and highest price. The bar between the two figures shows where the price is now: a dot near the left is near today's low, near the right is near today's high.
- 52-week range: the same for the last year.
- Off day high and Off 52-week high: how far below that high the price is now, in percent. A figure near 0% means the price is close to the high.
- Volume: how many shares changed hands today. Avg. volume (3M) is the daily average over the last three months, so you can tell whether today is busy or quiet.
The range bars and the "off high" figures follow the live price while the page is open.
#What the company is worth
- Market cap (market capitalization): the value of all the company's shares at today's price, in billions (B) or trillions (T) of dollars. It is the usual measure of how big a company is.
- Shares outstanding: how many shares exist.
- EPS (TTM): earnings per share over the trailing twelve months, which means the profit for each share over the last four reported quarters.
- P/E ratio (TTM): the price divided by those earnings. A P/E of 40 means you pay $40 for each $1 of last year's profit. A higher number means investors expect faster growth, or are paying more for the same profit; it is not good or bad on its own.
- Forward P/E: the price divided by the earnings analysts expect over the next twelve months.
- Profit margin: how much of each dollar of sales is left as profit.
#Income and risk
- Dividend yield: the yearly dividend as a percent of the price, with the dividend per share in brackets. A dash means the company pays none.
- Beta (5Y): how much the stock has moved compared with the whole market over five years. A beta of 1 means in line with the market; above 1 means swings bigger than the market's; below 1, smaller.
- Short interest: the share of the shares available to trade that investors have sold short, which is a bet that the price will fall. Hover over it for the number of days it would take to buy those shares back and the date of the report.
- Earnings date: when the company is next due to report. (est.) means the date is an estimate.
- Analyst target: the average 12-month price target of the analysts who follow the company. It is one view among many and is not a promise. See Research a company.
#For other kinds of instruments
Funds, coins, commodities and indexes show a different set. A fund shows Net assets, Expense ratio, Yield, YTD return and its 50-day average and 200-day average. A coin shows Market cap, Volume (24h) and Circulating supply. See Funds, indexes, coins and currencies.
#Common questions
Are the statistics live?
The price, the range markers and the "off high" figures follow the price. Figures such as EPS, P/E, market cap and the analyst target are updated less often, and some depend on the company's latest report. Prices may be delayed up to 15 minutes. See How fresh the data is.
Is a low P/E ratio a good sign?
Not by itself. A low P/E can mean a bargain, or that investors expect profits to fall. Compare a stock with its peers rather than judging the number alone, and remember that nothing on Finance is investment advice.
What does TTM stand for?
Trailing twelve months: the most recent four quarters of results.
Why do some stocks have no P/E?
A P/E needs positive earnings. A company that lost money over the last twelve months has none.